
Year-End 2025 Portfolio Review & 2026 Market Outlook
January 5, 2026

.png)
Brim 2025 Market Performance Recap and 2026 Outlook
As we close out another remarkable year, Bull Run Investment Management would like to extend our sincere gratitude for your continued trust and partnership.
2025 was a year of solid growth across much of the market, driven by advancements in technology, particularly AI. It was also a strong year for equity markets overall, but one where portfolio construction and factor exposure mattered significantly. Performance dispersion across different sectors and factors were wide, and results across our four strategies reflected their intended design and risk profiles.
Overall, our four core portfolios—Innovation, Growth, Core, and Low Volatility—navigated these dynamics with success. The Innovation Portfolio continued its standout trajectory, delivering exceptional returns amid the AI boom. The Growth Portfolio maintained steady performance against key benchmarks, while the Core Portfolio provided relative outperformance compared to the S&P 500. The Low Volatility Portfolio, true to its defensive nature, faced headwinds in a year favoring higher-growth assets, but remains a cornerstone for long-term stability.
Provided below is a review of each portfolio’s 2025 performance, complete with historical context, benchmark comparisons, and insights into what drove the results. All returns discussed are gross of our advisory fees, unless otherwise noted.
Innovation Portfolio: Top 1.32% Return Since 2023
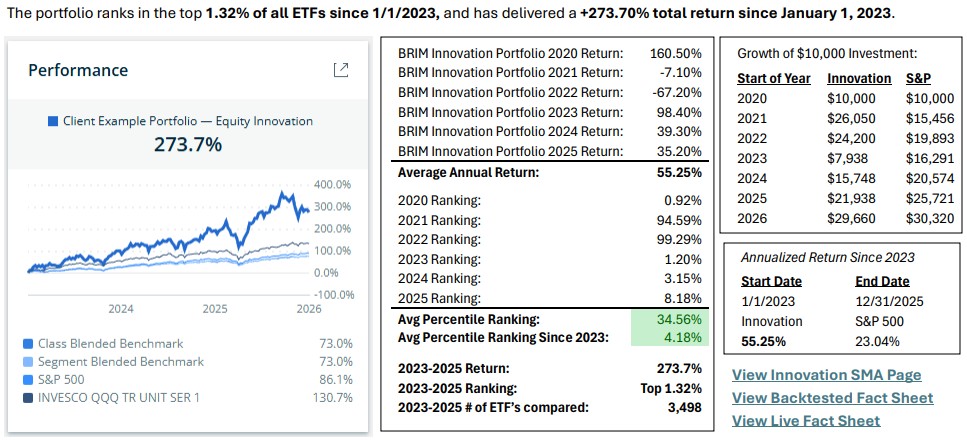
Innovation Portfolio 2025 (Gross of Fees):
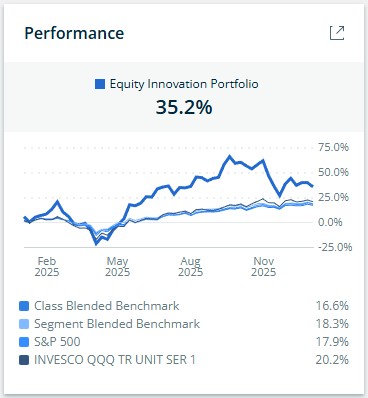
Our flagship Equity Innovation Portfolio had another banner year in 2025, delivering a +35.2% return, materially outperforming the S&P500 (+17.9%) and the Nasdaq-100 (+20.2%).
This places our Calendar Year 2025 return in the top 8.18% (outperforming ~91.83%) of all 4,888 non-leveraged ETFs trading in the US and Canada for 2025.
Outperformance was fueled by investments in leaders like Nvidia, Coreweave, and innovation platforms like Roblox and Reddit, which all reported many blowout quarters over the year, highlighting surging demand for AI data center infrastructure.
Looking back, 2025 builds on a track record of excellence:
- 2020: +160.5%
Top 0.92% of strategies for the year.
The portfolio capitalized on the post-COVID market recovery through high-conviction positioning, delivering a +160.5% return in less than ten months. - 2023: +98.4%
Top 1.20% of strategies for the year.
Through proactive positioning ahead of the AI acceleration phase, the portfolio delivered exceptional gains during the post-bear market recovery, dramatically outperforming the S&P 500’s 26% return. - 2024: +39.3%
Top 3.15% of strategies for the year.
Despite markets entering the year at all-time highs, our continued focus on AI adoption and selective expansion into adjacent technology subsectors drove strong absolute and relative returns. - 2025: +35.2%
Top 8.18% of strategies for the year.
The portfolio materially outperformed the S&P 500 (+17.9%) and the Nasdaq-100 (+20.2%) through disciplined, concentrated positioning in AI leaders such as Nvidia and Coreweave. - 2021: -7.1%
Returns reflected broad-based volatility and multiple compression across growth equities during the post-pandemic normalization period following the initial technology surge. - 2022: -67.2%
A challenging -67% return, placing us in the bottom quartile of strategies. This was largely due to the unprecedented tech bear market, where high-growth stocks experienced drawdowns well beyond historical norms (e.g., the ARK Innovation ETF fell over 80%).
Since our launch in early 2020, the Innovation Portfolio has compounded at approximately 19.55% annually (net of fees), resulting in a total return of over 180%, or roughly tripling invested capital over that period window. While this trails the S&P 500’s approximate 21.31% CAGR over the same full-period window, it reflects the impact of a historically severe drawdown in 2022.
As of September 17th 2025, the Innovation Portfolio was in the top 0.74% of all strategies for the year.
We are committed to our strategy of owning the companies driving the highest revenue growth across AI, software, and cloud infrastructure.
Growth Portfolio: Steady Performance with Room to Accelerate
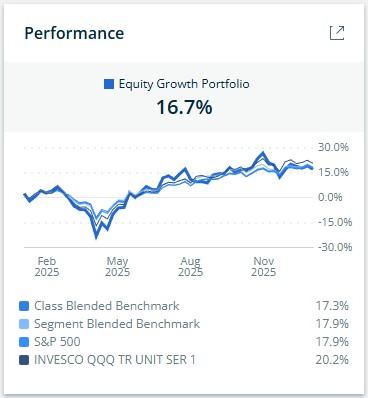
The Equity Growth Portfolio returned +16.7% in 2025, modestly underperforming the Nasdaq-100 (+20.2%) and finishing slightly below the S&P 500 (+17.9%). This relative lag was driven primarily by continued valuation compression across software and SaaS companies, which have not yet fully rebounded from the 2022 bear market despite improving fundamentals and earnings growth. Many core holdings traded at multiples well below historical averages throughout the year, limiting near-term upside.
While 2025 was a mild underperformance year, the longer-term results remain paint a fuller picture. Since its launch on April 14, 2022, the Growth Portfolio has generated an 85.6% cumulative return, vs. 62.7% for the S&P 500 over the same period, representing substantial outperformance since inception. This advantage reflects disciplined portfolio construction and the benefit of launching near the market bottom during the2022 drawdown. Looking ahead to 2026, we anticipate a rebound in software multiples as AI begins to boost productivity for cloud-based solutions and digital transformation tools. Combined with broader economic tailwinds, such as the fed lowering interest rates, this positions the Growth Portfolio for likely above-average recent returns—possibly exceeding its recent annual averages.
Core Portfolio: Outperformance in a Volatile Year with Little Downside
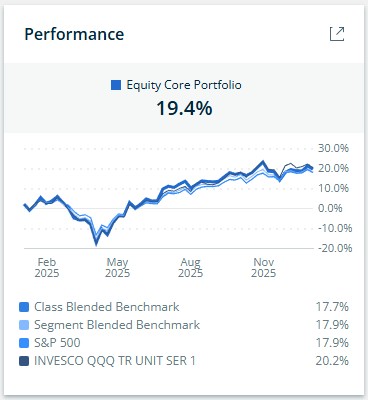
The Equity Core Portfolio returned +19.4% in 2025, outperforming the S&P 500 (+17.9%) while trailing the Nasdaq-100(+20.2%), exactly in line with the strategy’s objective. Core is designed to outperform the S&P 500 by a modest margin over full market cycles, typically 2–3% annually, while maintaining similar downside characteristics. In that context, 2025 represents a textbook outcome for the strategy.
Performance was driven by core holdings such as Nvidia, Alphabet, Apple, Taiwan Semiconductor, and Amazon, several of which accelerated meaningfully in the second half of the year. The portfolio also contains a small number of holdings that lagged in 2025 but remain fundamentally sound and positioned to rebound, providing additional upside potential heading into 2026.
Since the 2022 market low, the Core Portfolio immediately began outperforming the S&P 500, driven by its growth-oriented exposure participating more strongly in the recovery. While the strategy launched in mid-2021and therefore absorbed the full 2022 drawdown, it has materially outpaced the S&P 500 since the 2023 recovery began. As a result, since inception the portfolio has delivered an 85% cumulative return, closely matching the S&P 500’s 86%, with expectations that this post-low outperformance continues to compound over time, particularly for investors deploying capital through lumpsums and systematic averaging.
Low Volatility Portfolio: Defensive Positioning in a Risk-On Environment
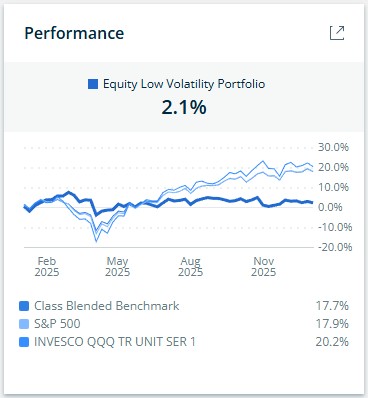
The Equity Low Volatility Portfolio returned +2.1% in 2025, a challenging result in a year that strongly favored higher-beta equities. This broadly reflected conditions across the low volatility factor, as the iShares’s USA Min Vol Factor ETF (SPLV) returned approximately 4.2%. While value-oriented segments such as the Dow performed better this year, low volatility is a distinct factor from traditional value investing. Value exposure can be achieved through diversified core equity strategies, whereas low volatility is designed specifically to reduce portfolio risk and drawdowns over time rather than maximize upside in strong equity markets.
Low volatility strategies tend to underperform in years dominated by aggressive growth leadership, particularly when technology and AI-driven equities lead market returns. Utilities, consumer defensives, and healthcare, which form the backbone of low volatility portfolios, face headwinds from early-year rate pressure and persistent sector rotation throughout 2025. This dynamic mirrors prior cycles where low volatility lagged during strong risk-on environments, similar to how innovation-oriented strategies struggled during 2022.
That said, low volatility remains an important long-term portfolio component. Over full market cycles, it has historically delivered equity-like returns with meaningfully reduced volatility and drawdowns. Since inception, the Low Volatility Portfolio has compounded at 6.7% annually, providing downside protection during periods such as 2022, when it limited losses to -19% versus -24% for the S&P 500. We view 2025 as a factor-driven outlier year and expect mean reversion as market leadership normalizes over time.
Reflecting on Our Long-Term Success and the Power of Compounding
Zooming out, our strategies have delivered exceptional results over the last three years and since our earliest launches in 2020. The Innovation Portfolio, for instance, has more than tripled in value since inception, with clients who entered at the 2022 bear market lows seeing nearly quadruple gains. Across all portfolios, we've compounded client capital at rates exceeding 20% in our highest-growth sleeves—far surpassing broad market indices.
To illustrate the magic of compounding: If we maintain a 20% annual return (a rate we've far exceeded in recent years) on a $100,000 IRA investment over 25 years, it would grow to approximately $9.539 million.
The last three years have put new investors well ahead of schedule relative to a 20% annual return, with recent performance materially accelerating long-term outcomes. Since January 1, 2023, the Innovation Portfolio has compounded at approximately a 63% annualized rate, well above its roughly 20% annualized return since launch. Even if future returns moderate substantially from recent levels, the portfolio would still be compounding from a significantly higher base, keeping long-term results well ahead of a steady 20% trajectory over time.
Optimistic Outlook for 2026: Primed for Potential Blowout Gains
The setup heading into 2026 is notably attractive across several dimensions:
- Interest rates are expected to move lower.
- AI-driven demand has shifted from speculative to proven.
- Software and platform valuations remain well below prior cycle highs.
- Many Innovation holdings are substantially off their previous peaks despite improving fundamentals.
As we turn the page to 2026, our enthusiasm is palpable—particularly for the Innovation Portfolio. Entering 2024 and 2025, markets were "frothy" after stellar prior years (e.g., 2023's 98.4% return pushed indices to all-time highs). Yet, we still delivered 39.3% and ~35% returns, respectively. In contrast to prior years where markets entered at or near all-time highs, current positioning offers greater upside potential should both earnings growth and valuation expansion occur simultaneously.
Today, the setup feels even more compelling: AI demand has been unequivocally proven, with NVIDIA's summer quarters echoing the transformative inflection point of April 2023. Metrics are now beginning to show AI accelerating productivity in data centers, autonomous systems, and enterprise AI, spilling over into SaaS and software—sectors, where multiples have been depressed (often 50-70% below 2021 peaks), are now ripe for a meaningful rebound in 2026.
Add to this the Federal Reserve's planned interest rate cuts, which should ease borrowing costs and boost valuations across growth equities. Many of our holdings—Coreweave, Astera Labs, Reddit, Roblox, and others—are trading substantially off their highs (some down 30-50% from peaks), offering asymmetric upside. We see potential for 50%+ gains in several names, with doubles not out of the question for the most undervalued names, all without stretching into overvalued territory. At the end of 2023 and 2024, we moved into the year with many positions at all-time highs, but that's just not the case this year—it's entirely different; we're moving into 2026 with many of our positions at a huge discount.
Bull Run Investment Management’s view aligns closely with Jamin Ball of Altimeter Capital Management, who manages a similar long-only innovation portfolio as ours with top percentage returns. He envisions 2026 resembling 2020 or 2021: a "spring loaded" year where private market valuations (e.g., in AI startups) spill into publics, driving broad rallies. We're not predicting 2023-level returns (98%+), but the ingredients—proven AI demand, low software multiples, Fed easing, and discounted entry points—suggest Innovation could outperform its 2024-2025 averages, potentially delivering even stronger results.
2026 Market Backdrop: Earnings, Valuation, and Implied Returns
Looking ahead to 2026, analysts project an average earnings growth of approximately 15% for the S&P 500 in 2026. The average year-end price target from Wall Street strategists is around 7,600, which, based on consensus earnings estimates of about $315 per share, implies a forward P/E ratio of roughly 24.1x.
This represents a normalization from today’s elevated valuation levels, where the market is currently trading at upper-20s P/E ratios, with earnings growth in 2026 expected to do the bulk of the work rather than further multiple expansion. In our view, this is a constructive setup: declining or stabilizing multiples offset by strong earnings growth, particularly in areas of the market tied to durable secular demand.
From our perspective, this base-case outlook largely aligns with how we are positioned today, and notably, it is one of the periods where we broadly agree with average analyst expectations, which is not always the case year to year. This framework is also consistent with what we have been communicating to clients. Within the AI and software segments of the market, we expect earnings growth to materially outperform the broader market, with little to no valuation compression across much of the space and, and in select areas of Software and AI, potential multiple expansion. If this environment unfolds as expected, we believe the Equity Innovation Portfolio is positioned to again rank in approximately the top 1%–3% of global equity strategies in 2026, inclusive of U.S. and international peers. Under this setup, we would expect Innovation performance to be at least comparable to 2024 and 2025 returns, with the potential to be modestly stronger, driven by fundamentals in AI demand, rather than sentiment or speculative upward valuation re-rating.
For our other portfolios, we also see constructive tailwinds. Growth is positioned for a stronger year than 2025 as software and SaaS multiples begin to expand alongside improving earnings and AI-driven productivity gains. Core is expected to deliver a typical outcome, with steady participation in equity upside and modest outperformance relative to the S&P 500, consistent with its long-term objective. Low Volatility should benefit meaningfully in 2026 as interest rates decline and factor-based strategies revert toward historical norms, following what was an unusually weak year for the low volatility factor in 2025.
Thank you again for your partnership. If you have questions or would like to discuss your portfolio in more detail, please don't hesitate to reach out. Bull Run Investment Management remains focused on managing risk thoughtfully while positioning client capital to capture long-term growth opportunities.
We look forward to the year ahead. Wishing you a prosperous 2026!
Best Regards,
Bull Run Investment Management, LLC
Sign up for our weekly newsletter.
Market Insights
Comprehensive market insights keep you informed. Our experts analyze financial trends and how they affect your investments and financial strategy. We give you a deep understanding of market dynamics to help you make smart decisions.

.png)
Questions? Seeking Further Insight?
Connect with our experts at BRIM.

“It's far better to buy a wonderful company at a fair price than a fair company at a wonderful price.”
Warren Buffet