Search Bull Run

Your New Quarterly Report Is Here — Designed for Clarity, Performance, and Transparency
July 15, 2025
.png)
As part of our ongoing effort to raise the standard of what a modern wealth management experience should feel like, we’ve rolled out automated, fully customized quarterly reports for all Bull Run clients — starting with Q2 2025.
These reports are securely delivered through your Black Diamond portal and are built to show your true net-of-fee performance, across all Bull Run-managed accounts and any outside accounts you’ve linked — like 401(k)s, IRAs, or brokerage accounts held at other firms. Below is a full breakdown of how your report is structured, what each section includes, and how to make the most of it each qaurter.
To access your new quarterly report, just log into your Black Diamond portal, navigate to the Vault section, and click on Reports. Your latest quarterly report will be available there for download. If you have trouble logging in or don’t see the report, just reach out and we’ll help you get it sorted.
Intro Cover Page + Table of Contents
(Sections 1 and 2)
- Section 1 — Cover Page
The report begins with a clean cover page displaying your household name and listing every account linked under your Black Diamond login. This includes all Bull Run-managed accounts as well as any outside accounts you’ve connected — such as IRAs, 401(k)s, trusts, or brokerage accounts managed by other firms. If an account appears on the cover, it’s included in the report. If not, it’s excluded from all calculations.
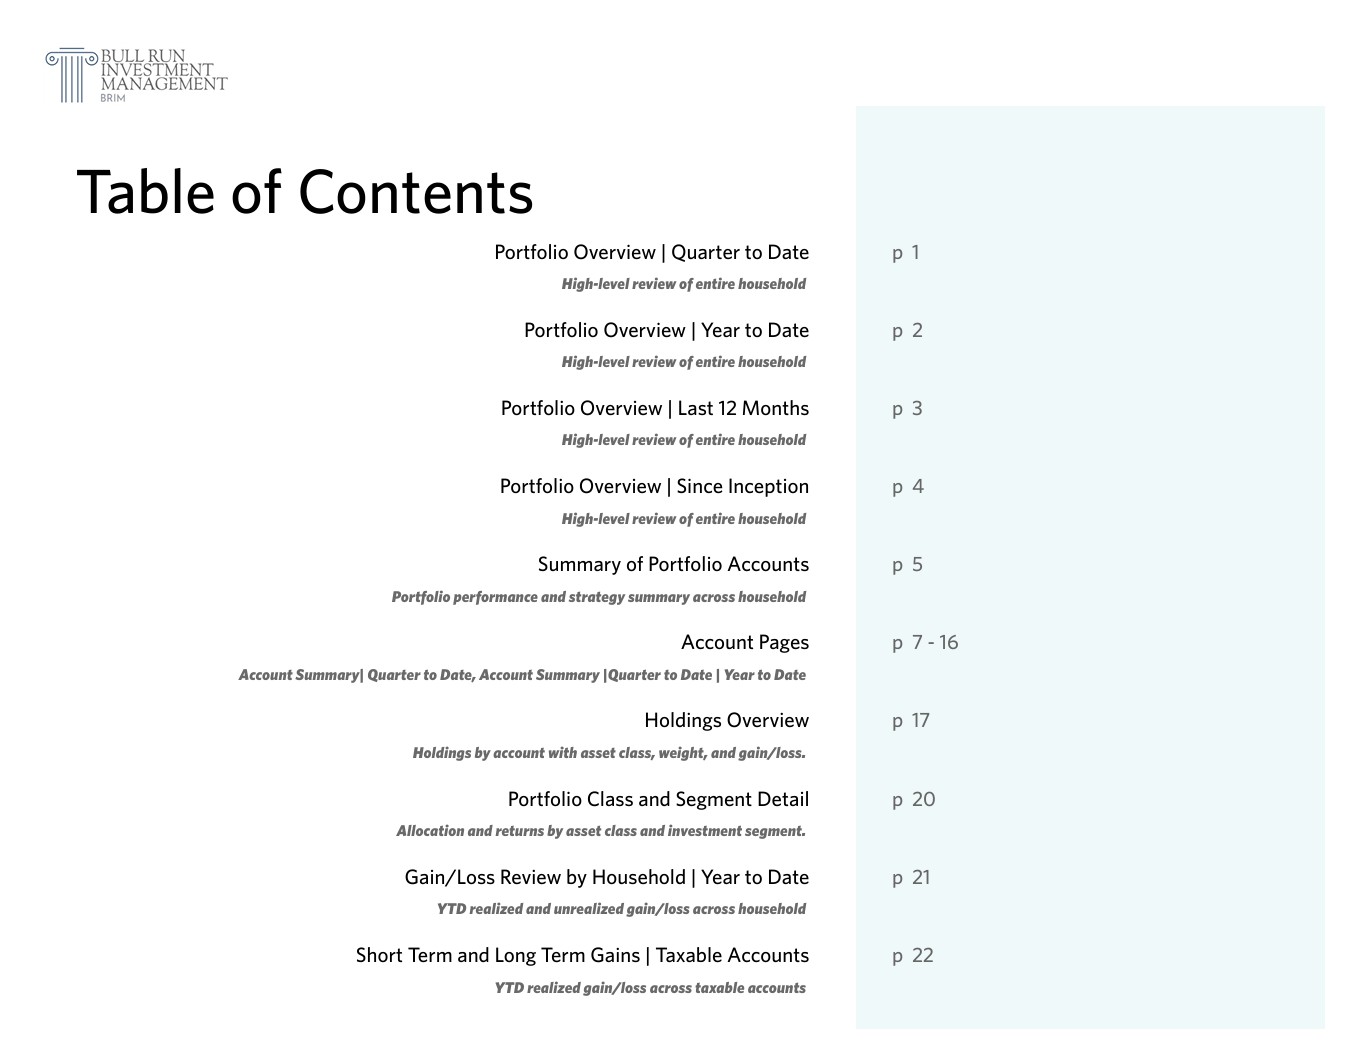
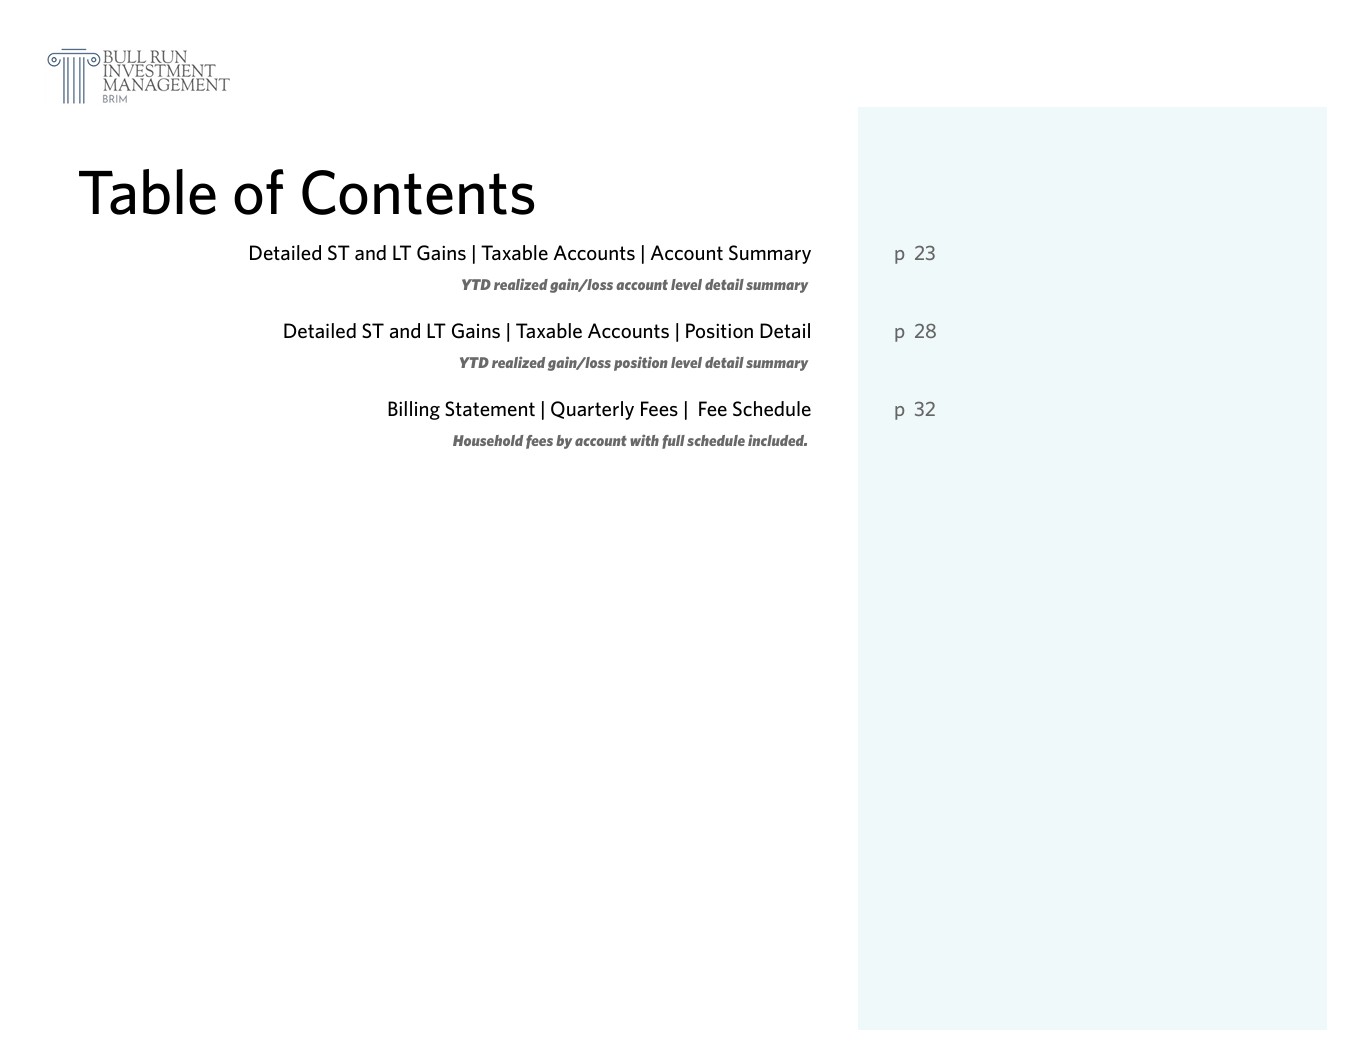
- Section 2 — Table of Contents
Immediately following the cover is a full table of contents outlining all 15 report sections in order. The number of pages per section will vary based on the number of accounts you have, the volume of holdings, and how long you’ve been with us — but the layout is standardized across all client reports. This page makes it easy to jump to the specific area you care about, whether that’s performance, billing, or tax-related gains.
Part 1 — Portfolio Overview
(Sections 3 through 6)
High-level review of entire household
These sections show performance across your entire household, including all of your accounts at Bull Run Investment Management, and any other outside accounts you may have with another financial advisor. Everything is shown net of fees and benchmarked against both the S&P 500 and a class-blended benchmark that reflects the asset group you're invested in (for example: small-cap growth, large-cap value, etc.).
The performance sections are stacked by reporting period, zooming out over time — so you start with the most recent quarter and expand out to your full performance history since inception
- Section 3 – Portfolio Overview | Quarter to Date
Net return and gain/loss for the most recent calendar quarter, including total contributions/withdrawals and benchmark comparisons. - Section 4 – Portfolio Overview | Year to Date
Net return and gain/loss for the most recent calendar quarter, including total contributions/withdrawals and benchmark comparisons. - Section 5 – Portfolio Overview | Last 12 Months
Net return and gain/loss for the most recent calendar quarter, including total contributions/withdrawals and benchmark comparisons. - Section 6 – Portfolio Overview | Since Inception
Net return and gain/loss for the most recent calendar quarter, including total contributions/withdrawals and benchmark comparisons.
Part 2 — Section 7 — Summary of Portfolio Accounts
Portfolio performance and strategy summary across household
This section gives you a complete summary of how your portfolios currently allocated and how each account is performing. It includes all accounts under your Black Diamond household, whether managed by Bull Run or another advisor you’ve linked. This is one of the best pages to get ahigh-level view of everything in one place.
This section includes to following:
- Your portfolio allocation by strategy — such as Equity Innovation, Growth, Core, Low Volatility, etc., broken down by each account
- Performance of your overall portfolio across all four reporting periods:
- Quarter to Date
- Year to Date
- Last 12 months
- Since Inception
- A performance summary for each individual account, reported net of fees
This section ties everything together and helps you understand how your accounts, strategies, and allocations are all working in combination.
Part 3 — Section 8 — Account Pages
Account Summary| Quarter to Date, Account Summary | Quarter to Date | Year to Date
This section shows how each of your individual accounts is performing. It includes all Bull Run-managed accounts as well as any outside accounts you’ve linked that are managed by another financial advisor. Each account is displayed separately so you can clearly see how each one is performing, both on its own and compared to market benchmarks.
You’ll see:
- Net performance for each individual account
- Net additions for each period
- Benchmark comparisons for each account (S&P 500 and class-blended benchmark
- Two performance periods for each account
- Quarter to Date
- Year to Date
- Each account appears as a two-page set: the first page shows Quarter to Date, and the second page shows Year to Date. This makes it easy to follow and track short-term and YTD performance.
Part 4 — Holdings Overview & Segment Detail
(Sections 9 and 10)
Holdings by account with asset class, weight, and gain/loss
This part gives you a full look at what you currently own across all accounts — both Bull Run-managed and any outside accounts you’ve linked. It includes a line-by-line list of every holding in your portfolio, plus a detailed breakdown of how your portfolio is allocated across market segments.
You’ll see:
- Every position you currently hold across all accounts
- Current market value, cost basis, unrealized gain/loss, and portfolio weighting
- Asset class and investment style assignments (e.g., large-cap growth, mid-cap blend)
- A breakdown of how your portfolio is positioned across those style categories
- YTD return by segment so you can see which parts of the market have been contributing the most
This part includes the following two sections:
- Section 9 – Holdings Overview
Holdings by account with asset class, weight, and gain/loss
Full list of current holdings by account, including asset class, market value, cost basis, unrealized gain/loss, and overall weight in your portfolio.
- Section 10 – Portfolio Class and Segment Detail
Allocation and returns by asset class and investment segment
Breaks your portfolio into investment style categories — such as large-cap growth or small-cap value — and shows how much is allocated to each, along with YTD performance for each segment within your portfolio.
Part 5 — Gain/Loss Review | Year to Date
(Sections 11 through 14)
Realized and unrealized gains across all accounts and taxable accounts
Part 5 covers all realized and unrealized gains and losses so far this year — with the first section giving a full household snapshot (including taxable and non-taxable accounts), and the next three sections zooming in specifically on realized gains within your taxable accounts.
If you're looking for a quick estimate of what you might owe in taxes this year, Section 12 is your go-to. It shows your total realized short-term and long-term gains across all taxable accounts — which you can then multiply by your applicable tax brackets. In most cases, short-term gains (assets held <12 months) are taxed as ordinary income (typically 24–37%),while long-term gains (assets held >12 months) are taxed at lower capital gains rates (typically 15–20%).
You’ll see:
- Total gain/loss across all accounts (realized + unrealized) (section 11)
- Realized capital gains broken down by short-term and long-term
- Clear separation between taxable and non-taxable accounts (section 12)
- Detailed views by account (section 13) and by individual position (section 14)
Detailed Breakdown of Part 5 Gain/Loss sections:
- Section 11 – Gain/Loss Review by Household | Year to Date
YTD realized and unrealized gains/loss across household
Snapshot of cost basis, ending value, realized gains, and unrealized gains across all accounts in your household — including both taxable and non-taxable accounts. - Section 12 – Short Term and Long Term Gains | Taxable Accounts
YTD realized gains/loss across taxable accounts
Shows total realized capital gains across all taxable accounts, broken down into short-term and long-term. You can use this page to get a direct estimate of your tax exposure using your personal tax brackets. - Section 13 – Detailed ST and LT Gains | Taxable Accounts | Account Summary
YTD realized gain/loss account level detail summary
Breaks down your realized gains by account, so you can see which taxable account(s) contributed the most to realized gains or losses this year. - Section 14 – Detailed ST and LT Gains | Taxable Accounts | Position Detail
YTD realized gain/loss position level detail summary
Drills into the individual positions that were sold this year at a gain or loss. Helps you track which securities are driving your tax liability.
Part 6 — Billing Summary
(Section 15)
Household fees by account with fee schedule included
This section provides a complete summary of how your portfolio was billed for the quarter. Fees are calculated based on the average daily balance of your total household portfolio throughout the quarter, using your assigned fee schedule.
For clients under a flat percentage model, each account is billed individually based on its average balance and flat rate. For clients under a tiered fee schedule, billing is calculated at the household portfolio level, and you may see a secondary table showing $0 billed on each individual account — this is normal. Your actual fee will be shown in the tiered table beneath it.
You’ll see:
- Ending portfolio value for the quarter
- Billed value (average daily balance for the quarter)
- Total advisory fee charged
- Fee amount applied to each account
- Your fee schedule, including tiers if applicable
- If under tiered billing, a second table showing how much was billed in each tier bucket
Part 6 ensures full transparency on how fees are calculated and applied, whether you're under a flat-rate or tiered structure.
Quarterly Report Delivery
BRIM Client reports are automatically delivered each quarter through your Black Diamond client portal, and you’ll receive an email notification as soon as your new report is available. If you didn’t receive yours, it may be because your portal hasn’t been fully activated yet or is still connected to an outdated email address. Just let us know and we’ll get that corrected right away.
If you did not receive your report, it likely means your Black Diamond portal hasn’t been fully activated or is tied to an outdated email address. Let us know and we’ll get that resolved right away. Likewise, if you notice any account titling issues, believe a specific account is missing, or received a duplicate email in error, just reach out and we’ll take care of it.
As a reminder, Black Diamond lets you link outside investment accounts — like 401(k)s, IRAs, and brokerage accounts not currently managed by us — to give you a complete, unified view of your portfolio. This includes accounts still held at other financial firms. Even if a small portion of your assets is managed elsewhere, we highly recommend linking those accounts so you can track everything apples-to-apples, all in one place. The process only takes a couple of minutes.
To see how to link outside accounts to your Black Diamond portal, view our client guide here.
Questions? Seeking Further Insight?
Connect with our experts at BRIM.

“It's far better to buy a wonderful company at a fair price than a fair company at a wonderful price.”
Warren Buffet